RUNTIME & MEMORY · 10 MIN READ
Go 1.27 small allocations: benchmark the runtime, then the application
Understand size-specialized allocation without overstating the gain. Compare toolchains, allocation rate, retained memory, pooling and latency under real load.
Event: · Reporting and practical analysis. Sources listed below.

A runtime improvement with a modest application claim
The Go team’s 16 September 2026 explanation of size-specialized memory allocation describes a Go 1.27 optimization for selected small heap allocations. The published account reports allocation operations becoming up to 20–30% faster in the relevant cases, with roughly 1% improvement in allocation-heavy applications. Those are upstream observations, not measurements of your service and not a promise that every allocation becomes cheaper by the same amount.
The official article explains the implementation. The practical opportunity is to evaluate the new toolchain without confusing three different questions: how often the application allocates, how much memory it retains, and how much time users spend waiting. These questions can move independently. A useful rollout connects them through a representative workload and a readable comparison. This article develops that procedure around a small request-processing service, including an allocation benchmark, a retention review and a release decision that remains understandable after the headline has faded.
Separate allocation rate from live memory
Imagine a Go service that validates events and forwards accepted records to a downstream queue. Every request creates a small metadata object. The service also keeps a cache of recently observed identifiers. The metadata may be short-lived, while the cache deliberately retains data between requests. A runtime allocation improvement can affect the first cost without changing the policy that controls the second.
Write down both lifetimes. The request metadata belongs to one operation and should become irrelevant when that operation finishes. The identifier cache belongs to a longer-lived component and needs an explicit eviction rule. If memory keeps growing because the cache never evicts, a faster path for creating metadata does not repair the ownership problem.
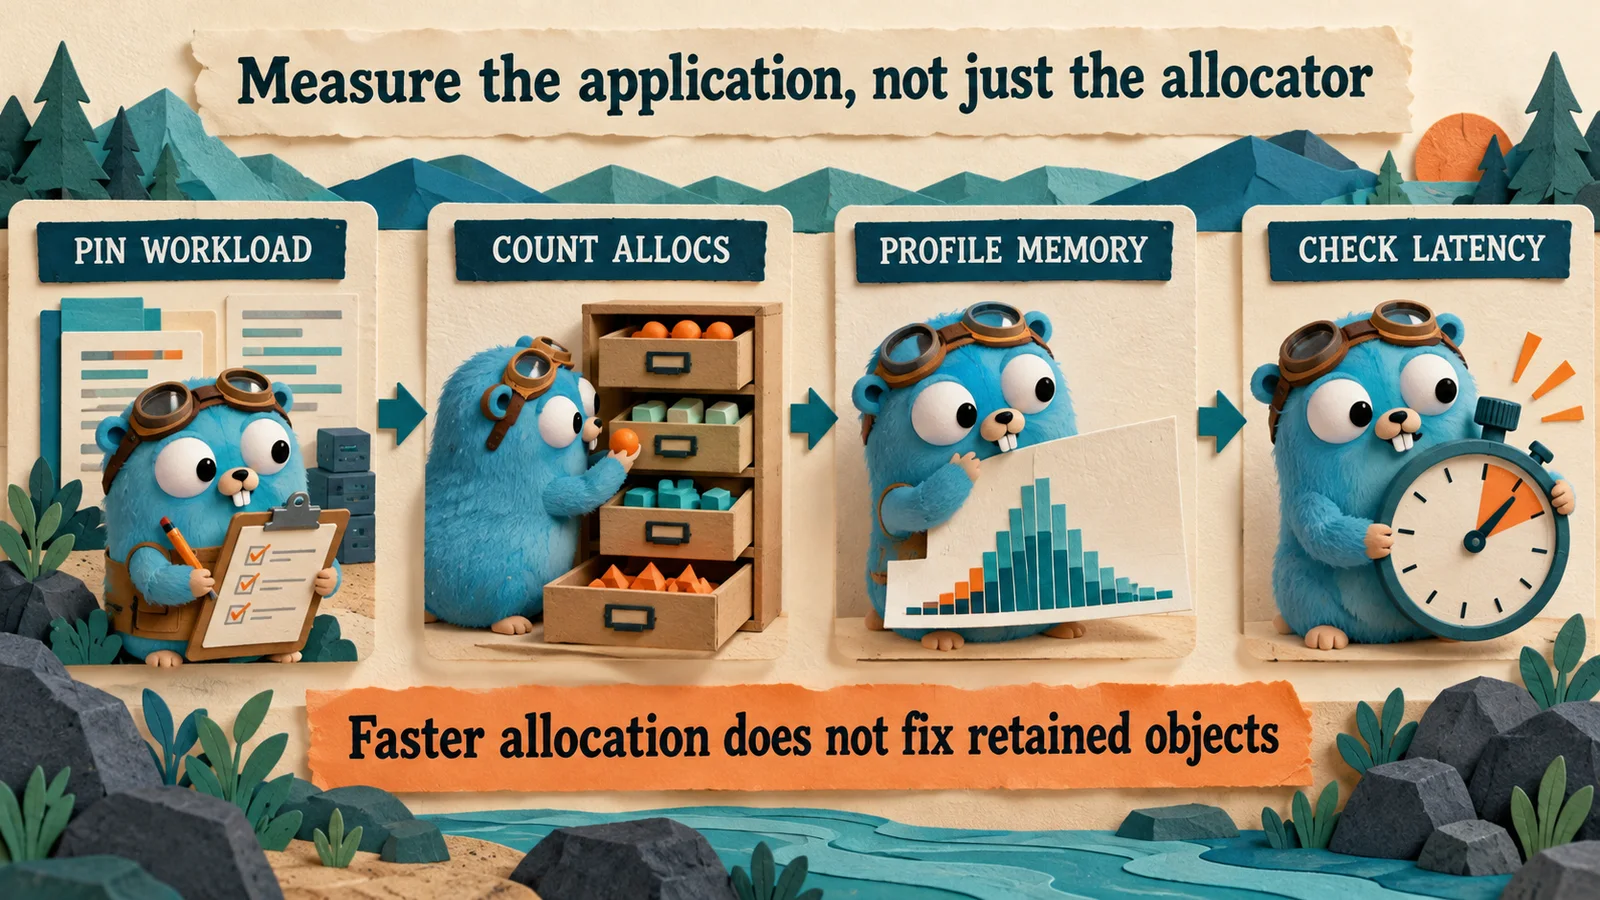
This distinction gives the investigation useful names. Count allocation work over a defined interval, inspect the data that remains live, and observe end-to-end latency under the same workload. Avoid a single dashboard label such as “memory performance” that hides all three. The Go garbage-collector guide is a primary reference for interpreting allocation and live-heap behavior. Your service design supplies the other half: which objects should still exist, who owns them and when their retention is supposed to end.
Establish a baseline that represents traffic
Choose a workload with the input sizes and concurrency your service actually sees. Include both ordinary requests and a small number of larger records. Keep the downstream queue behavior controlled so that a network slowdown does not masquerade as a memory regression. Record the configuration and the candidate’s toolchain before collecting results.
Start with the existing implementation. Measure completed operations, errors, latency and resource use together. Keep the observation window long enough to include steady operation rather than only startup. If the service has a warm-up phase or a cache that fills gradually, describe that phase explicitly instead of comparing a cold candidate with a warm baseline.
Then write the expected effect of the toolchain change. A reasonable hypothesis might be that request throughput improves slightly when allocation work is a meaningful part of CPU consumption. Another might be that no user-visible change appears because downstream waiting dominates. Both are legitimate predictions. Defining them in advance discourages selective reporting later. Our runtime and memory lessons offer a useful preparation route for distinguishing a runtime mechanism from the application behavior it may influence. The baseline turns the release note into an experiment rather than a marketing number.
Use a microbenchmark to ask one narrow question
A microbenchmark can isolate the cost of creating a small object, provided the result remains observable to the compiler. The following example deliberately makes the allocated pointer escape through a package-level sink. It models one operation; it does not model an entire request or a production cache.
var allocationSink *requestMeta

type requestMeta struct {
    tenant   uint64
    sequence uint64
    flags    uint32
}

func BenchmarkRequestMeta(b *testing.B) {
    b.ReportAllocs()
    for i := 0; i < b.N; i++ {
        allocationSink = &requestMeta{sequence: uint64(i)}
    }
}
Place the fragment in a test package that imports testing. Run repeated samples with the same benchmark code and representative toolchains, retaining the full command and environment with the results. For example, go test -run '^$' -bench BenchmarkRequestMeta -benchmem -count=8 can be a starting command in that package.
Check the allocation count instead of assuming that a source-level & guarantees a particular runtime event. The testing reference documents the benchmark facilities. Treat the experiment’s output as an answer about this narrow operation, then return to the full service before making a deployment or performance claim.
Read profiles as evidence about ownership
An allocation profile and a live-heap profile can tell different stories. A frequently called parser may create many temporary objects, while a rarely updated registry retains most of the process’s memory. Fixing the registry’s ownership can be more valuable than reducing a parser allocation, even when the parser is prominent in an allocation-oriented view.
For the event service, inspect the metadata path and the identifier cache separately. Ask whether the cache stores complete request objects when it only needs a compact identifier and timestamp. Check whether a small retained slice keeps a much larger input buffer reachable. These are questions about the application’s data structures and lifetimes; the runtime cannot decide which business data the service still needs.
Use profiles to choose a concrete hypothesis, then confirm it in source and tests. A stack trace identifies an allocation site, but it does not automatically identify the policy that caused the object to remain reachable. The runtime/pprof reference explains the available profile views. Keep a note describing the view used for each conclusion so a future reader does not confuse total allocation work with currently retained data. That small documentation step makes a performance review far easier to repeat.
Do not add pooling just because allocation is visible
A pool introduces a new lifecycle: a caller obtains an object, uses it, resets it and returns it without letting another owner keep a reference. That can be appropriate for some workloads, but it also creates opportunities for stale state and accidental sharing. A visible allocation in a profile is not enough to justify that additional protocol.
Suppose the event service pools metadata containing a tenant identifier and a scratch buffer. The review must now prove that the next user cannot observe the previous request’s tenant or retain a reference to the scratch storage after return. If that proof is complicated, a small ordinary allocation may be the better engineering choice. The runtime improvement makes measuring that choice more worthwhile, not less.
Try the simple version first, then compare a proposed pool under the same representative workload. Include correctness tests that exercise reuse across different inputs and concurrent operations. Do not evaluate the pool only in a single-threaded happy path. Keep the implementation boundary small enough that ownership is visible. The clean-code material provides a useful companion to this review: performance code still needs an interface that makes correct use understandable to the next engineer.

Compare toolchains without changing everything else
A toolchain comparison is easier to interpret when the source, workload and application configuration remain fixed. If the team changes a cache policy, rewrites the parser and upgrades Go in one candidate, a favorable result will not explain which change helped. Separate the changes when practical, or explicitly describe the limits of the combined experiment.
Record the compiler selected by the build, rather than relying on the version installed in a developer’s shell. Keep the built artifact’s identity with the results and verify that the deployment ran that artifact. A benchmark table attached to the wrong executable is not useful evidence, no matter how carefully the numbers were collected.
Also include the target architecture and deployment constraints. A development laptop and a CPU-limited service container can emphasize different costs. The new allocator path is a runtime mechanism, but the practical result belongs to a particular application on a particular target. The current Go release notes are the primary source for supported configuration and known changes. Our reproducible-build analysis covers the separate task of making the compiler, recipe and artifact traceable across the experiment and rollout.
Keep capacity and latency in the same conversation
The event service may look healthy at low traffic and struggle when requests arrive faster than the downstream queue accepts them. More in-flight work can retain more request data, even if each allocation becomes slightly cheaper. A runtime optimization does not replace a decision about the maximum work the service is willing to hold.
Model that limit explicitly. Decide how many operations may be active, what happens when capacity is exhausted and which data remains reachable while a request waits. Measure the service near that boundary instead of assuming a faster microbenchmark increases safe concurrency by the same proportion. A good load test includes controlled overload and recovery, not only a steadily increasing throughput curve.
Review the user-visible outcome. Does the service return a clear error, apply backpressure or allow an unbounded internal queue to grow? These choices shape memory behavior more strongly than a small-object optimization in many systems. They also connect performance work with architecture. The Go service interview guides help practice explaining capacity as a design decision. An engineer should be able to describe why the application retains each class of data while work is queued, running, completed or abandoned.
Decide what would count as a useful result
Before rollout, agree on the result that would justify adopting the candidate. That may be a small resource saving at unchanged latency, a clearer operational margin under a known load or simply the absence of regression during a necessary toolchain update. The decision should fit the application’s goals rather than demand a dramatic speedup from every runtime release.
Keep negative results. If the allocator microbenchmark improves but the service does not, document the difference. It can indicate that the request path is dominated by other work, or that the workload rarely reaches the affected allocation cases. That information directs the next investigation and prevents the team from repeatedly optimizing the same low-impact area.
For interview preparation, ask a colleague to explain how lower allocation cost can coexist with growing memory use. Then introduce a retained slice, a cache without eviction and a blocked worker. Each changes the ownership story in a different way. The goroutine-leak analysis explores the last case. A strong explanation connects object lifetime, workload and resource limits without reducing the entire runtime to one preferred tuning knob.
The next practical step
Choose one representative request path, capture a baseline and run a controlled toolchain comparison. Add the small benchmark only if it helps explain the result. Inspect retained data before introducing a pool, and include overload behavior before increasing concurrency. Publish the actual scope of any improvement with the release evidence.
The September announcement is valuable because runtime work can improve ordinary programs without asking every application author to write a custom allocator. The most useful response is equally ordinary: upgrade deliberately, measure the application and keep ownership clear. There is no need to turn an implementation detail into a new abstraction throughout the codebase.
If the team finds a measurable benefit, retain the workload and command so the next release can repeat the check. If it finds no meaningful end-to-end change, keep that result too. Either outcome is progress when it narrows uncertainty and protects a readable implementation. Faster allocation is one part of a Go program’s behavior; a sound performance decision explains how that part connects to the work users actually need the program to finish.
Primary sources & editorial method
We checked these primary references on 21 October 2026. Release facts are attributed; recommended workflows and examples are GopherForge analysis. Illustrations are conceptual, not vendor screenshots or benchmarks.